|
|
|
|
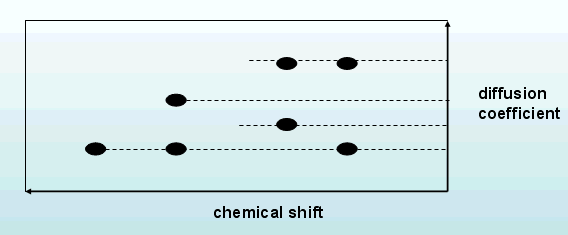
The DOSY (Difussion-Ordered SpectrocopY) experiment provides accurate, noninvasive, molecular diffusion measurements on biofluids, complex chemical mixtures and multicomponent solutions. In DOSY spectra, chemical shift is along the detected F2 axis and diffusion coefficient is along the other F1 axis.REQUIREMENTS
Implementation on AVANCE spectrometers equipped with pulsed field gradients (PFGs).VERSIONS
The DOSY experiment is performed by recording consecutive spectra in which the gradient strengths are incremented in a series of 1D proton acquisitions ( 92JACS3139 , 93JACS4291 , 94JPC603 , 94AC211 , and 98MRC706 ). Several pulse sequences can be used for this purpose:EXPERIMENTAL DETAILS
- The pioner experiment to measure self-difussion coefficients was the PFG-based spin-echo pulse sequence.
- Stimulated-Echo pulse sequence (STE experiment). Minimizes the effect of short T2.
- Double Estimulated-Echo pulse sequence (DSTE experiment) ( 01JMR259-152 ) .
- LED pulse sequence. Minimizes the effect of eddy currents.
To more info, go to NMR Diffusion Home Page
Other interesting approaches have been described in detail:
- Removing eddy current effects by using bipolar gradients ( 95JMRA260-115 )
- Minimizing phase-based artifacts ( 99JMR205-139 ).
- Using high fields ( 95JMRB170-108 )
- 3D analogs of the basic 2D DOSY experiment
DOSY experiment can be recorded in routine and automation modes and minor changes are required if a predefined parameter set is available. The user needs to choose the pulse sequence and experimental conditions to be used: the strength, duration, shape of the gradients, the recovery delay, diffusion delay ....SPECTRAIn simple solutions, data can be manually recorded, processed and analyzed taking individual isolated resonances as a reference.
More details on practical implementation of DOSY experiments on AVANCE spectrometers can be found in the corresponding Tutorial: ge-2D DOSY experiment.
The basic 2D DOSY spectrum displays conventional chemical shift in one dimension and difussion coefficient constants in the other dimension. Because of the relationship between difussion coefficients and the molecular radii, the difussion dimension reveals the distribution of molecular sizes and allows different molecular species to be unambiguosly identified and assigned. This difussion dimension is achieved by recording consecutive spectra in which the gradient strengths are incremented in a series of acquisitions.RELATED TOPICS
Analyzing individual 1D spectra, signal intensity decreases as a function of the gradient strength. Analyzing signal intensity vs gradient intensity a exponential dependence arises. Analyzing signal intensity vs B, a linear dependence allows to obtain the diffusion coefficient.
Related experiments:2D homonuclear experiments 2D gradient-based homonuclear experiments