7.3 MAS of biological samples
Plant, tissue and food samples can be investigated by HR-MAS NMR. The usefulness of magic angle spinning within these fields of study is demonstrated in the examples shown below.
Figure
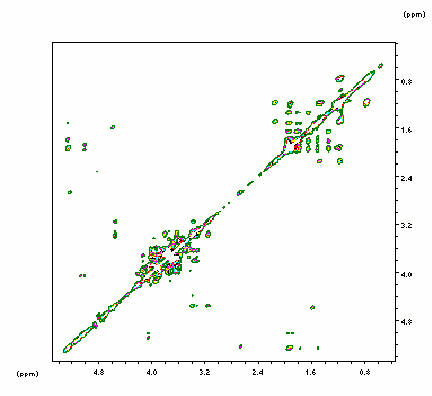
7.8 shows a 1 H 2D TOCSY
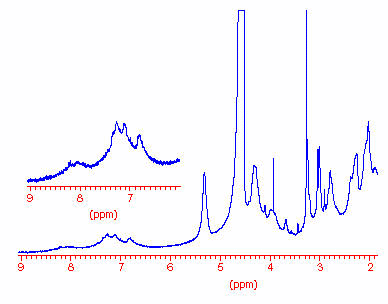
spectrum of a sample of orange peel under MAS. In figure 7.9 the
800 MHz proton spectrum of red perch filet is shown. Figure 7.10 shows spectra
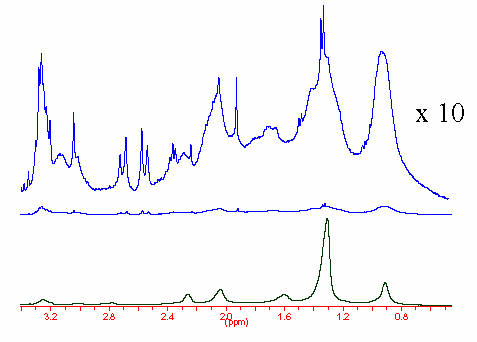
of benign and malignant prostate tissues, obtained via biopsies. The cancerous
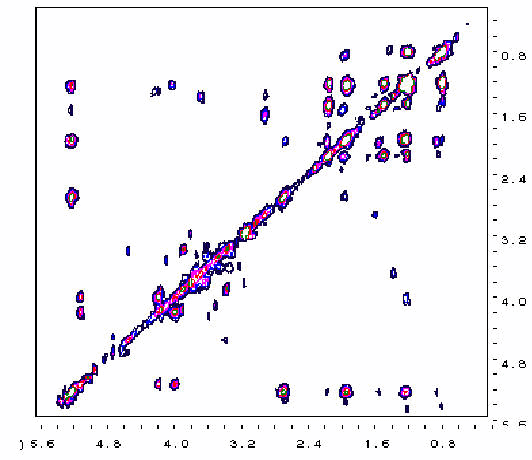
tissue shows a strongly enhanced lipid content. Figure 7.11 displays
a TOSCY spectrum, obtained from a living white worm, which allows one to
study drug metabolism in vivo.

Figure 7.8. 2D TOCSY/ hr-MAS spectrum of orange peel, cut to small pieces, flushed and measured in D 2 O, obtained under the following NMR-conditions: Avance-400, 2800Hz spinning, 4mm-rotor with spherical insert, 2.7mg of sample, phase sensitive 2D-TOCSY with presaturation of the residual water signal, 8 scans/400 increments, linear prediction to 800 points in f1, window function shifted sine bell squared in both directions (ssb=2).

Figure
7.9. 8 mg red perch filet, cut, flushed and measured in D 2
O. Avance-800, 128 scans 15KHz spinning.

Figure 7.10. Hr-MAS of benign versus malignant human prostate tissue Hr-MAS of benign (top two spectra) versus malignant (bottom) human prostate tissue. Avance 400 MHz, 4000 Hz spinning. The cancerous tissue shows a strongly enhanced lipid content.

Figure 7.11. TOCSY-presat of a living white worm (enchytraed) in 95% H 2 O/5% D 2 O. Avance-400 8scans/300incr. MAS 2800 Hz.